
Equity option competition-part II
/In a series of articles, Cornelius Müller, the Paris-based Sales Representative for Eurex Exchange with global sales responsibility for single equity options, provides insights into developments in European equity options. This segment at Eurex Exchange encompasses +750 single equity options from thirteen countries. In this article, Cornelius gives an update on various country segments and reports on why liquidity is moving on-screen.
Across Europe, European equity options liquidity moves on-screen

The landscape in European options markets is changing and liquidity is not as sticky as it used to be. Liquidity is progressively moving away from local exchanges to one single European platform, in part driven by companies’ needs to maximize their collateral utilization. Exchanges and their associated clearing houses that feature netting between large numbers of products are at an advantage.
The graphs depicted below show the total volume by market including block volumes transacted off-book. This article continues the discussion of equity options migration on-screen that was started in a previous article on brokerdealer.nl. This article refers to some comments stating that “…most of the trades done on Eurex in the Dutch segment are reported OTC trades”. This article addresses – and refutes - this claim.
Our findings confirm that in the past, volume on Eurex Exchange in Dutch equity options could be attributed to a larger extent to off-screen trades. This was in itself a good sign for the usability, flexibility and the service delivered by our Trade Entry Services available on our market. Whenever a new product was launched at Eurex Exchange, it was always available for on-screen trading with appropriate Market Maker support providing price transparency, unlike on other venues and platforms.
Strong on-screen volume in the Netherlands
Looking at 2015, we can observe for the Dutch segment a shift from off-book block trades to on-screen trades. Looking at data from options on Dutch underlyings we can still see a mixed picture for the closest expirations in 2014. That picture changed in the first three quarters of 2015, with the first three expirations being clearly traded with a preference for on-screen.

Looking at the volume per expiry comparison between the periods from January to September 2014 to that same period in 2015, it looks like block volume in the first expirations was shifted to on-screen volume.


Now this development is quite interesting when looking at the market shares for Dutch equity options, taking in account all volume, the picture shows a slowly declining TOM and a rebounding Euronext.
Taking however only on-screen trading, one can observe a slowly rising Eurex becoming more and more competitive for on-screen trading in the Netherlands.

The French market split: Increase in market share due to on-exchange volume
The same development can be observed in other countries. In the first article of this series, it was outlined that the French equity options market was progressively developing towards a neat split in terms of market share between Euronext and Eurex Exchange. Over the last months, both exchanges were around the fifty percent for options business on French underlyings.


Taking only the on-exchange volume into account, the graph looks much smoother with Eurex Exchange approaching consistently the fifty percent barrier showing the same rising trend like in the Netherlands.
The block volumes over the last year remained stable on Eurex Exchange and the increase in total volume came from on-exchange transactions, which resulted over time in a higher market share over Euronext regarding the total volume. The Euronext on-exchange volume for France came down from 1 million contracts at the beginning of 2014 to on average 850,000 contracts per month over the last two quarters. In the same period, the Eurex volume established itself averaging above 700,000 contracts coming from below 600,000.

Closest expirations moving on-screen
Just like in the Netherlands, we can see the second trend when we look at the figures of the moving liquidity. In the French segment, last year all expirations primarily were traded via the Eurex Trade Entry Services. Now, on-screen transactions dominate the first two expirations.

The picture is also quite interesting when we lookat the differences in volume between on- and off- screen trades. Comparing the period from January 2014 to September 2014 to the same period in 2015, we can see that the block volumes remained stable and that all additional volume was created on-screen.

The Swiss and German country segments, which are amongst the most liquid options in Europe, are now dominated by on-screen trades up to the 4th expiration. That increase of on-screen liquidity may attract new market participants such as CTAs.
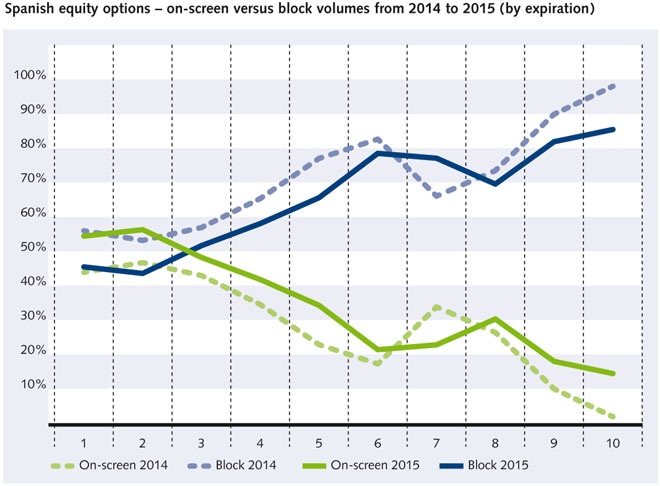
Same picture in Spain and Italy
In the Spanish and Italian segment, we have also seen higher market shares over the last two years and in Italy especially over the last six months. The additional market share on these markets is also mostly driven by on-exchange volume, e.g. for Spain reaching a proportion of 40% up from about 20% at the beginning of 2013. The total monthly volume is averaging above 550,000 contracts, resulting in a stable market share at 25 per cent.

Looking at Eurex figures only, the proportion of on screen transactions is steadily rising.

This is also reflected breaking the figures down to the different expirations: In the first three expirations, the majority of volume transacted in 2015 was on-screen whereas in 2014, most of trades were block trades.

The same holds partially true for Italy: in the first two contracts a clear shift to on-screen even though the picture is mixed in the longer dated ones. The total market share in Italy stands currently at 19 percent after an especially strong August with close to 25 percent.

The most dynamic option segments on Eurex Exchange, where most of the volume came from off-book block trades, is now predominantly traded on-screen. This is especially the case for the first three expirations where spreads in the book are the same across the different exchanges. Reasons for that might stem from more DMA access for end customers or also buy side companies choosing on screen trades to comply with the best execution obligations.
The shift to on-screen trading mirrors our experience in other European equity options markets and, taken together with those observations, seems to indicate a pan-European phenomenon.
For further information about our equity derivatives segment, please visit www.eurexchange.com > equity derivatives or contact Cornelius Müller.
For further information about Eurex Clearing Prisma and the bespoken margin efficiencies, please click here.